Most supervisors ask for a Gantt chart with your proposal, and most students draw one the night before it’s due, never to look at it again. That’s a shame, because a good dissertation Gantt chart is the simplest way to see, months ahead, whether you’ll make your hand-in date.
This guide shows you how to build one that actually helps: what goes on it, how long each stage really takes, and how to keep it alive once the work starts. It works for an undergraduate dissertation, an engineering final-year project or a master’s dissertation. There’s a note for PhD students at the end.
The short version: start from the hand-in date and work backwards, give every phase an end date and a “done means”, keep 10% of your time spare before hand-in, and update the chart every week rather than once.
What a dissertation Gantt chart is (and isn’t)
A Gantt chart is a timeline with your project’s tasks as bars across the weeks. The length of each bar is how long the task takes; the bars that overlap are the ones you’ll be doing at the same time. Milestones, such as the proposal deadline, ethics approval and the full draft, are single points on the line.
It isn’t a promise. Research changes as you do it. The chart’s job is to show you early when something is slipping, so you can do something about it while there’s still time.
How to make one, step by step
1. Start from the hand-in date
Put the submission date at the right-hand end and work backwards. Then add the dates your university has already set: proposal, ethics, interim report, presentation or viva. These don’t move, so everything else fits around them.
2. Keep 10% spare before hand-in
Take roughly a tenth of your time off the end and leave it empty. With seven months, that’s about three weeks. It will be used: illness, a dataset that arrives late, a printer queue on hand-in day. A plan with no slack fails at the first surprise.
3. Add the phases
Almost every dissertation goes through the same stages, whatever the subject. The shares below are a sensible starting point for an undergraduate or master’s project:
| Phase | Share of your time | Done means |
|---|---|---|
| Topic and proposal | First 10–12% | A working research question; the proposal handed in |
| Ethics (if you work with people) | 8–18% | Approval letter saved; don’t collect data before it |
| Literature review | 5–35% | Notes on the key sources and a draft chapter |
| Methodology or design | 20–35% | Methods chosen and justified, a draft chapter |
| Data, experiments or building | 30–60% | Everything collected or built, and backed up |
| Analysis | 55–72% | Results, figures and tables |
| Writing | 35–80% | Every chapter drafted; the full draft with your supervisor |
| Revisions and proofreading | 80–95% | Feedback worked through, references checked |
| Formatting and hand-in | Last 5% | Your department’s format, the word count, a receipt |
Notice that writing starts a third of the way in and overlaps everything after it. The biggest mistake on student Gantt charts is a single “Write up” bar in the last month. Write each chapter while the work behind it is fresh: the literature review as you read, the methods as you design, the results as you analyse. Leave the introduction and conclusion until last, because only then do you know what you’re introducing.
4. Break each phase into tasks of a week or two
“Literature review” is a phase, not a task. Tasks are things you can finish in a week or two: search the databases with my keywords, read and summarise the ten key papers, draft the literature review section on X. If a bar on your chart is longer than a month, split it.
5. Mark the milestones
Add the moments that matter as diamonds or flags: proposal submitted, ethics approved, full draft to supervisor, hand-in, presentation or viva. Put the full draft about 80% of the way in. Your supervisor needs time to read it, and you need time to act on what they say.
6. Check it against the rest of your life
Shade the weeks you’ll lose: exams, other coursework deadlines, holidays, placements. If your data collection lands on top of exam season, now is the time to move it, not the week it happens.
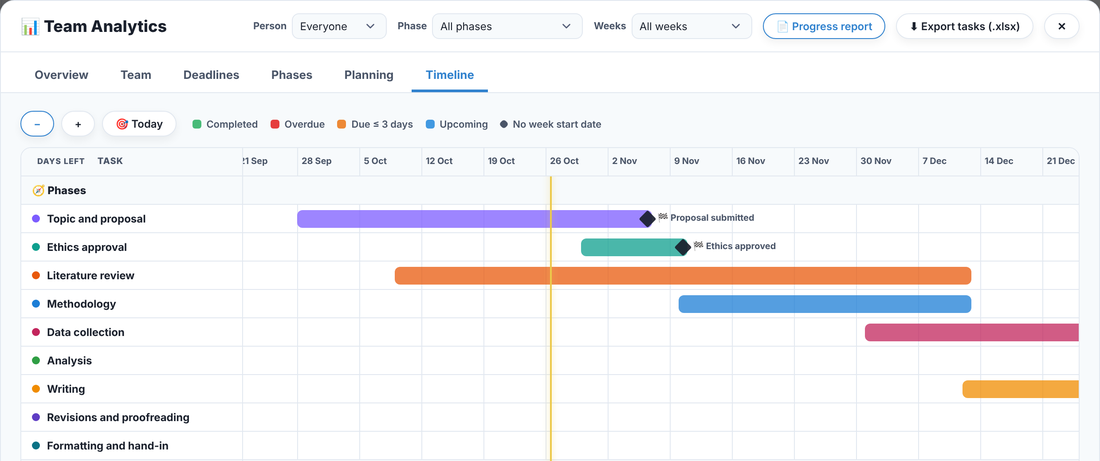
An example: a seven-month undergraduate dissertation
Say you start on 5 October and hand in on 30 April. Using the shares above:
- Oct: first supervisor meeting, choose a topic and question, proposal in by early November.
- Oct–Dec: literature review, with ethics approval sorted by mid-November if you need it.
- Nov–Dec: methodology chosen and written up.
- Dec–Feb: data collection, or building and testing, with the results chapter started as you go.
- Feb–Mar: analysis, then the discussion, conclusion and introduction.
- Mid-March: full draft to your supervisor.
- Late March–April: revisions, references, proofreading, formatting, hand-in.
Excel, a template, or something that keeps itself up to date
You can draw a Gantt chart in Excel or Google Sheets with coloured cells, one column per week. It works, and it’s what many supervisors expect to see in a proposal. The trouble is that a spreadsheet chart is a picture: when a task slips, nothing moves unless you redraw it, so most stop being updated by week four.
If a spreadsheet is what you need, start from our free dissertation Gantt chart template for Excel and Google Sheets: type your start and hand-in dates and every bar moves to fit, with late tasks turning orange on their own.
Whatever you use, the habit matters more than the tool. Once a week, tick off what’s done, move what isn’t, and look at the next milestone. If the same task has slipped three weeks running, re-plan it, split it or ask your supervisor about it.
If you’re doing a PhD
The same ideas apply over three or four years, but plan in phases rather than weeks: the literature review and research questions, training and ethics, a pilot study, the upgrade or confirmation review (usually 9–18 months in), your main studies, papers and conferences, annual reviews, writing up, submission, the viva and corrections. Plan the next term in weeks and the rest in phases, and re-plan at every review.
Make yours in two minutes
Trawpie has a free dissertation planner that does the steps above for you. Tell it your level, start and hand-in dates and any university deadlines, and it lays out the phases, tasks with checklists and milestones on a timeline, with 10% spare before hand-in. Then it keeps the plan alive: unfinished tasks carry into the next week, you can track word counts per chapter, and your supervisor can see your progress if you invite them.
Free for students: undergraduate, master’s and PhD. It plans and keeps track; the writing is all yours.
For the plan behind the chart (counting the weeks you really have, working with your supervisor and the weekly review), read How to plan a dissertation from your hand-in date. For running a team project week by week, see How to plan a student engineering project.